


Understanding how independent home improvement operations are performing throughout the year helps retailers in the channel compare themselves to others and use that data to make improvements to their operations.
Since 2022, the North American Hardware and Paint Association (NHPA) has partnered with The Farnsworth Group to produce the Independent Retailer Index, which tracks key performance metrics quarterly.
Every quarter, the index asks independent home improvement retailers to share year-over-year changes in:
- Transaction count and size
- Inventory investment
- Cost of goods
- Profit margin dollars
- Future operational investments
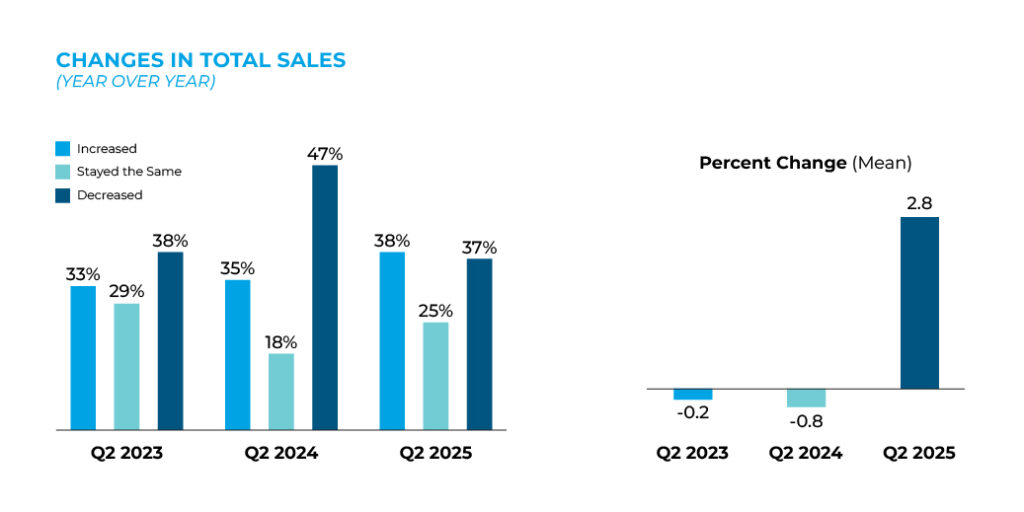
The most recent Independent Retail Index shares some potentially positive signs about independent retailers’ performance in Q2, but a deeper look at the numbers somewhat tempers this outlook.
According to the index, which fielded responses from 68 different companies, representing hundreds of independent storefronts across the U.S., 38% of respondents reported that sales increased in Q2 2025 versus Q2 2024. This number compares to the 37% reporting sales declines and 25% posting flat sales during the period.
The mean sales increase from respondents in Q2 2025 versus the same period last year was 2.8%; however, looking at the median data, sales for the group were flat year over year. This median data more closely corresponds with some of the national averages being reported by the Department of Commerce, which shows the industry down 0.5% through the first six months of the year and off slightly in Q2.
“I think, in essence, this data is showing us that the industry and independents are kind of stalled right now,” says Dan Tratensek, NHPA COO. “There are pockets of the country that are definitely performing better than the average, but overall I think we are still trying to get things moving in a positive direction.”
![]()
![]()