

Looking at how fellow independent home improvement operations are performing throughout the year gives retailers in the channel the data to make improvements to their operations.
Since 2022, the North American Hardware and Paint Association (NHPA) has partnered with The Farnsworth Group to produce the Independent Retailer Index, which tracks key performance metrics quarterly.
Every quarter, the index asks independent home improvement retailers to share year-over-year changes in:
• Transaction size and count
• Inventory investment
• Cost of goods
• Profit margin dollars
• Future operational investments
The most recent Independent Retailer Index shares some insight on how retailers are performing amid economic uncertainty. According to the index, which fielded responses from 57 different companies, representing hundreds of independent retailers across the U.S., 57% of respondents reported increased year-over-year sales growth, up 29% from Q3 2024 and continuing the upward trend from 2023.
“The third quarter was a small bright spot in an otherwise mediocre year for independent retailers,” says Dan Tratensek, NHPA chief operating officer. “The majority of our respondents indicated that sales were up year over year during the quarter, on average, about 2%. However, when you factor that 73% of our respondents were reporting increases in cost of goods, a fair bit of this positive momentum is likely due to rising prices. A stronger indicator of potential market momentum might be found in the second straight quarter, where we are registering an increase in transaction count from 2024. If dealers can continue to drive more transactions, it could be one key to breaking out of of the malaise the industry has been in.”
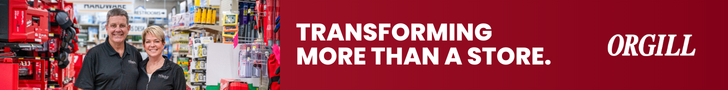
Changes In Inventory (Year over Year)
In Q3 2025, 45% of retailers reported an increase in inventory investment, up 19% from Q3 2024 but slightly
below the 47% reported in Q3 2023. The average net inventory change rose by 3.9% year over year, a notable
jump from 0.3% in Q3 2024 and 2.5% in Q3 2023.
Investment Plans for the Next 12 Months- Top Responses
Inventory
- 65%: Paint & Sundries
- 55%: Lawn & Garden
- 40% Hand & Power Tools
- 40%: Plumbing
- 35%: Hardware & Fasteners
- 35%: Electrical
- 30%: Lumber & Building Materials
- 25%: Stains
Investment Plans for the Next 12 Months- Top Responses
Technology Solutions:
- 44%: Digital Marketing
- 40%: Web/E-Commerce
- 28%: Point-of-Sale System
- 16%: Store Communications System
- 8%: Electric Shelf Labels
- 16%: None of These
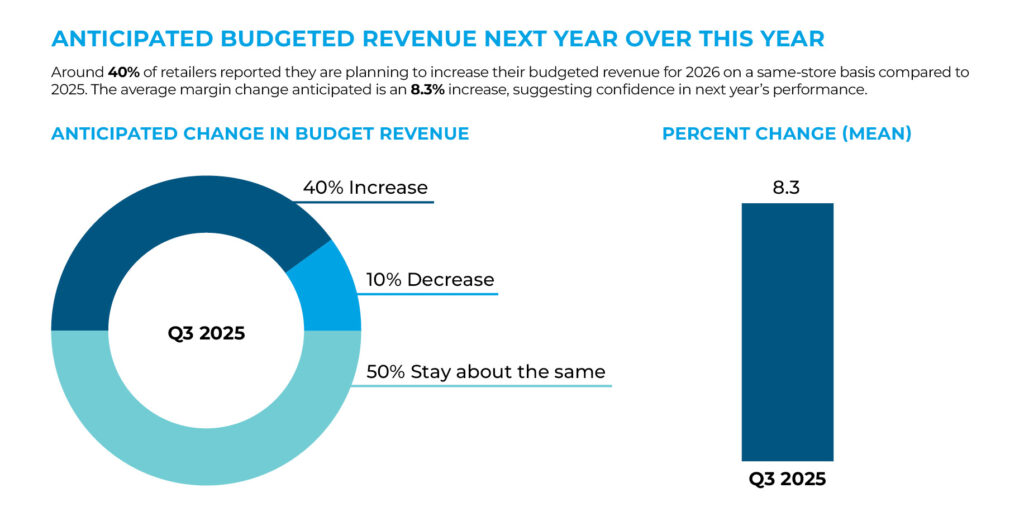
Anticipated Budget Revenue Next Year Over This Year
Around 40% of retailers reported they are planning to increase their budget revenue for 2026 on a
same-store basis compared to 2025. The average margin change anticipated is an 8.3% increase,
suggesting confidence in next year’s performance.
Investment Plans for the Next 12 Months
Staff/Employees
- Plumbing: 40%
- Hardware & Fasteners: 35%
- Paint & Sundries: 65%
- Lawn & Garden: 55%
Access the Index
Be sure you’re on the list to receive the newest data from the Independent Retailer Index quarterly. Head to
YourNHPA.org/research to subscribe today.